
Compound Interest Calculator: How $200/Month Becomes $500k
$200 a month doesn't feel like much. But invested consistently at a reasonable return, it becomes more than half a million dollars in 35 years — and most of that money is interest you never had to earn. Use the calculator below to see your own numbers.
Last updated: July 7, 2026 · 18 min read · Interactive calculator included
Most people understand that investing is important. Fewer understand just how dramatically the math plays out over time — not because of heroic returns or lucky stock picks, but because of a single mechanism that Einstein allegedly called "the eighth wonder of the world": compound interest.
The core idea is simple. You earn returns not just on your original investment, but on your previous returns too. Small amounts become large amounts not because you put in more money, but because the interest itself starts generating interest — and that process snowballs over time in a way that's genuinely counterintuitive until you see the numbers.
What compound interest actually is (and why it's different)
Simple interest grows linearly. If you put $1,000 into something earning 8% simple interest annually, you earn $80 every year — always on the original $1,000. After 10 years: $1,800.
Compound interest grows exponentially. The same $1,000 at 8% compounded annually earns $80 in year one — but in year two, you earn 8% on $1,080. In year three, on $1,166. By year 10: $2,159. That's $359 more, from the same starting point and same rate — just from letting interest earn interest.
Simple Interest — $1,000 at 8%
After 30 years: $3,400 — $2,400 in interest
Compound Interest — $1,000 at 8%
After 30 years: $10,063 — $9,063 in interest
The difference is stark: the same $1,000 at the same 8% rate over 30 years produces $10,063 with compounding vs. $3,400 with simple interest. Now imagine adding $200 every single month on top of that — which is what the calculator above is showing you.
The math behind the magic — explained simply
The formula for future value with regular monthly contributions is:
FV = P × (1 + r)^n  +  PMT × [((1 + r)^n - 1) / r]

Where:
  FV  = Future Value (what you end up with)
  P   = Initial lump sum (if any)
  r   = Monthly interest rate (annual rate ÷ 12)
  n   = Total number of months (years × 12)
  PMT = Monthly contribution amount

Example: $200/month, 8% annual rate, 35 years
  r   = 0.08 / 12 = 0.006667
  n   = 35 × 12 = 420 months
  FV  = 0 + 200 × [((1.006667)^420 - 1) / 0.006667]
  FV  = 200 × [(16.95 - 1) / 0.006667]
  FV  = 200 × 2,388
  FV  ≈ $477,600   (≈$500k with slightly higher returns or initial sum)
You don't need to memorize this formula — the calculator above does it for you in real time. But understanding what's inside helps: the (1 + r)^n term is what creates exponential growth. Every month, your entire balance gets multiplied by a factor slightly above 1. Over 420 months, that multiplier compounds to almost 17×.
How $200/month reaches $500k — step by step
Let's trace the journey in detail. $200/month invested in a broad index fund averaging 8% annually — a conservative estimate of long-term US stock market returns after inflation adjustments — over 35 years. Here's what happens decade by decade:
| Year | You invested | Interest earned | Total value |
|---|---|---|---|
| Year 5 | $12,000 | +$2,695 | $14,695 |
| Year 10 | $24,000 | +$12,589 | $36,589 |
| Year 15 | $36,000 | +$33,208 | $69,208 |
| Year 20 | $48,000 | +$69,804 | $117,804 |
| Year 25 | $60,000 | +$130,205 | $190,205 |
| Year 30 | $72,000 | +$226,072 | $298,072 |
| Year 35 | $84,000 | +$374,776 | $458,776 |
Look at what happens in the last decade. Between year 25 and year 35, the portfolio grows by more than it accumulated in the first 25 years combined. That's the exponential curve in action. The early years feel slow. The later years feel like the money is multiplying on its own — because it essentially is.
Breaking down the $477k final value
18% of the final amount
82% of the final amount
You contributed $84,000. The other $393,000 was generated by compound growth. For every $1 you put in, compound interest added $4.68.
Growth milestones at different monthly amounts
$200/month is just one example. Here's what different monthly contributions produce over 30 years at 8% annual returns:
| Monthly amount | You invest total | Final value | Interest earned | Multiplier |
|---|---|---|---|---|
| $50/mo | $18,000 | $74,518 | +$56,518 | 4.1× |
| $100/mo | $36,000 | $149,036 | +$113,036 | 4.1× |
| $200/mo | $72,000 | $298,072 | +$226,072 | 4.1× |
| $300/mo | $108,000 | $447,108 | +$339,108 | 4.1× |
| $500/mo | $180,000 | $745,180 | +$565,180 | 4.1× |
| $1000/mo | $360,000 | $1,490,359 | +$1,130,359 | 4.1× |
Notice that every row has the same multiplier — about 3.5× your total contributions — because the interest rate and time period are the same. The power of compound interest is available to anyone who starts, regardless of amount. $50/month still becomes $74,000 over 30 years from only $18,000 invested.
How much does the interest rate actually matter?
A lot. The difference between 6% and 10% over 35 years isn't the obvious 4 percentage points — it's a factor of almost 2× in final wealth. Here's the same $200/month over 35 years at different rates:
3% annual return
High-yield savings account
$148k
5% annual return
Conservative bond-heavy portfolio
$227k
7% annual return
Balanced stock/bond portfolio
$360k
8% annual return
S&P 500 historical average (approx.)
$459k
10% annual return
Aggressive all-equity portfolio
$759k
The gap between 3% (savings account) and 8% (index fund) after 35 years is roughly $350,000 on identical contributions. This is why leaving money in a savings account instead of investing it isn't safe — it's expensive.
Why starting at 25 vs 35 is a $300k difference
The most important variable in compound interest is time — not the return rate, not the monthly amount. Starting 10 years earlier with $200/month at 8% produces more additional wealth than doubling your contribution for the same period.
Start at 22, invest until 65
$200/mo × 43 years = $103,200 contributed
$895k
Start at 25, invest until 65
$200/mo × 40 years = $96,000 contributed
$698k
Start at 30, invest until 65
$200/mo × 35 years = $84,000 contributed
$459k
Start at 35, invest until 65
$200/mo × 30 years = $72,000 contributed
$298k
Start at 40, invest until 65
$200/mo × 25 years = $60,000 contributed
$190k
Starting at 30 instead of 25 costs you roughly $220,000 at retirement — from just 5 years of delay on $200/month contributions. Those 5 missing years would have contributed only $12,000 extra in cash, but they would have generated over 18× that in compound growth. Time is the one input you can never buy back.
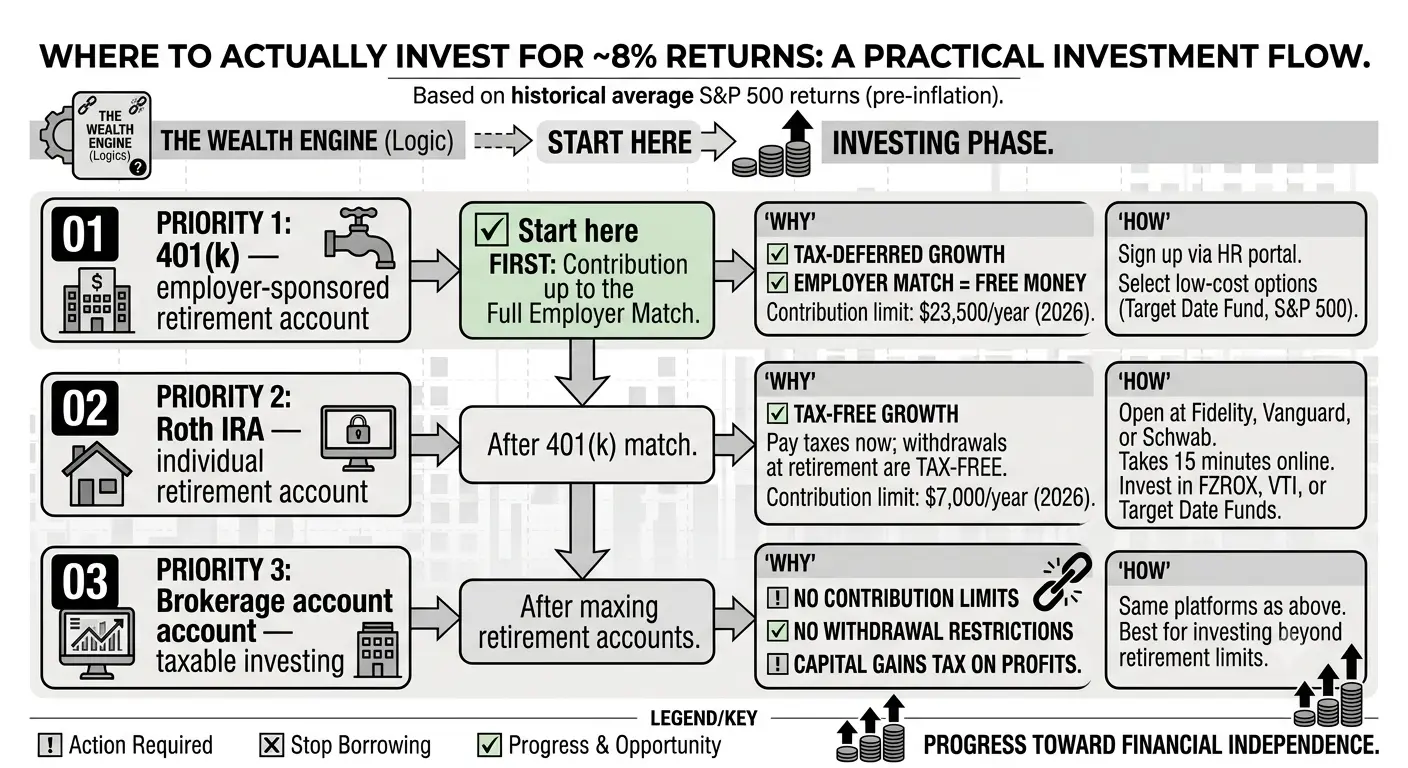
Where to actually invest to get these returns
The calculator assumes an 8% average annual return — the approximate historical average of the US stock market (S&P 500) over the past 50+ years, before inflation. Here's how to practically access that return:
401(k) — employer-sponsored retirement account
Start hereWhy: Tax-deferred growth. Many employers match contributions (free money). Contribution limit: $23,500/year in 2026.
How: Sign up through your employer's HR portal. Select a low-cost index fund option (usually a 'Target Date Fund' or S&P 500 index fund).
Roth IRA — individual retirement account
After 401k matchWhy: Tax-free growth — you pay taxes now, withdrawals at retirement are tax-free. Contribution limit: $7,000/year in 2026.
How: Open at Fidelity, Vanguard, or Schwab. Takes 15 minutes online. Invest in FZROX, VTI, or a target date fund.
Brokerage account — taxable investing
After maxing retirementWhy: No contribution limits, no restrictions on withdrawal. You pay capital gains tax on profits.
How: Same platforms as above. Best for investing beyond your retirement account limits.
⚠️ 8% is an average — not every year
The stock market doesn't return exactly 8% per year. It swings: +25% one year, -18% the next. The 8% is the long-term average. Short-term you'll see volatility. The answer is to keep investing through downturns — you're buying more shares at cheaper prices, which amplifies your returns when the market recovers. This is why automating contributions beats trying to time the market.
The mistakes that kill compound growth
Compound interest works automatically if you let it. Most people interrupt it in one of these ways:
Cashing out when the market drops
Impact: CatastrophicSelling during a crash locks in your losses and removes your money from the recovery. A $10k loss during a crash that you stay invested through eventually becomes a gain. A $10k loss you sell during a crash is permanently $10k gone — plus all the future growth on that money.
Waiting for the 'right time' to start
Impact: SevereThere is no right time. Every month you wait costs more than any market timing could save. The best time to start was 10 years ago. The second best time is today. Use the calculator above — set years to 30, then 29, and watch the final value drop.
Paying high fund fees (expense ratios)
Impact: HighA 1% annual fee sounds small. On a $200k portfolio, it's $2,000/year — gone before any growth. Over 30 years of compounding, a 1% fee difference reduces your final balance by roughly 20-25%. Use index funds with expense ratios below 0.10%. Vanguard's VTI charges 0.03%.
Stopping contributions during hard times
Impact: ModerateLife happens — job loss, big expenses. But pausing contributions for even 2–3 years has a lasting impact because those months of non-investment compound for decades. If you must reduce contributions, reduce the amount rather than stopping entirely.
Keeping all savings in a bank account
Impact: SevereSavings accounts in 2026 earn 4-5% at best. That's below the long-term equity return and barely keeps pace with inflation. Money that sits in cash while you 'figure out investing' is losing ground every year relative to where it would have been.
FAQ
Is 8% a realistic return to expect?↓
What if I can only invest $50 or $100/month?↓
Does compound interest work the same way in a 401(k) or Roth IRA?↓
How does inflation affect these projections?↓
Should I pay off debt before investing?↓
What index funds should I actually buy?↓
Key takeaways
- 1$200/month at 8% over 35 years grows to ~$477k. You contributed $84k. Compound interest generated the other $393k.
- 2The multiplier is the same for any amount — $50/mo, $500/mo. What changes is the scale, not the mechanism.
- 3Time matters more than amount. Starting 10 years earlier is worth more than doubling your monthly contribution.
- 4The rate matters hugely over long periods. Savings account at 3% vs. index fund at 8% = $350k difference on $200/month.
- 5Use the calculator at the top to find your personal number — plug in your actual monthly amount and years left.
- 6Invest in low-cost index funds (VTI, FZROX) via a 401(k) or Roth IRA. Automate contributions so you never skip a month.
Keep building your financial foundation
Compound interest is the engine. These guides help you put more fuel in:

Finance & Fintech Research Team
The Kodivio team analyzes financial tools, investment platforms, and fintech trends based on independent research and market data.
Learn more about us →