Budgeting with Google Sheets
Build a complete personal finance system in Google Sheets to track expenses, manage savings goals, analyze spending habits, and automate dashboards easily.
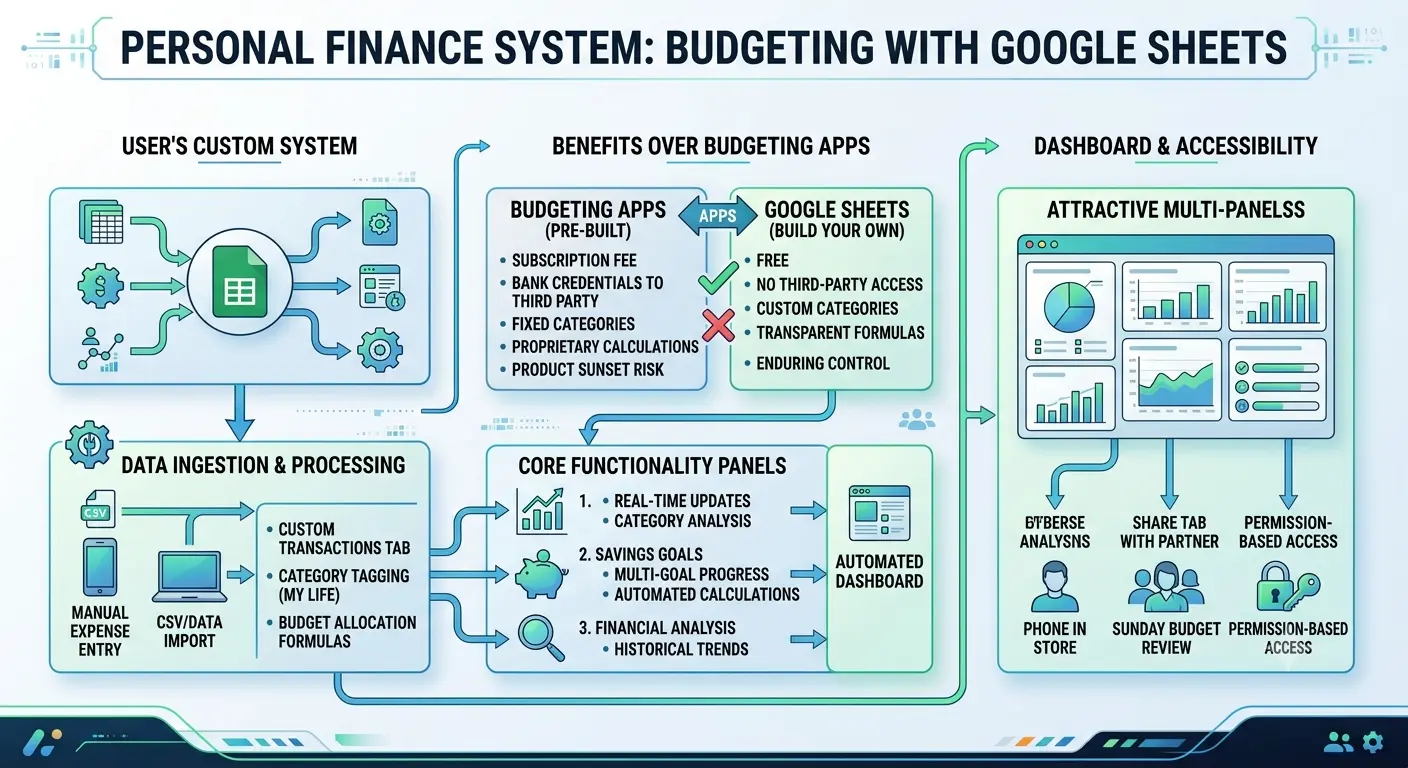
Why a Spreadsheet Still Beats Most Budgeting Apps
Every few months a new budgeting app promises to fix your finances with AI insights and slick notifications. Most people try one, get annoyed when it miscategorizes a coffee purchase as "transportation," and quietly stop opening it three weeks later. Google Sheets has none of that polish, but it has something more valuable: you can see exactly how every number is calculated, and nothing changes underneath you without your permission.
There's no subscription fee, no company deciding to sunset the product, and no bank credentials to hand over to a third party. You build the categories that actually match your life instead of squeezing your spending into someone else's taxonomy. And because it's just a spreadsheet, it travels with you. Open it on your phone in the grocery store, on your laptop during a Sunday budget review, or share a single tab with a partner without giving them access to your entire financial life.
The tradeoff is that nobody hands you a finished system, you have to build it. The good news is that a working budget spreadsheet only needs four or five tabs and a handful of formulas you'll reuse constantly. The rest of this guide walks through building that system from scratch, the way someone who actually maintains theirs every month would set it up.
Setting Up Your Spreadsheet Foundation
Resist the urge to throw every column you can think of onto a single sheet. A budget that lives in one cluttered tab is a budget nobody opens twice. Instead, split the work across a small number of purpose-built tabs:
- Dashboard – the one tab you actually look at day to day. Totals, charts, and how much budget is left in each category this month.
- Income – every paycheck, side income, refund, or gift that comes in.
- Expenses – the full transaction log. This is where most of your typing happens.
- Categories – a short lookup list (Groceries, Rent, Transportation, and so on) that feeds dropdown menus everywhere else, so you never end up with both "Eating Out" and "Dining" splitting the same spending in two.
- Savings Goals – separate from monthly expenses because goals run on a different timeline.
Build order matters: set up the Categories tab first, before touching any of the others. Everything else references it, and renaming categories later means hunting down dropdowns and formulas in several places at once.
Keep the Categories tab dead simple: one column for the category name, one optional column for a monthly budget amount next to it. That budget number becomes the target every other formula on the sheet compares against.
Building the Expense Tracker
The Expenses tab is the engine of the whole system, so give it room to work: Date, Category, Description, Amount, Payment Method, and an optional Notes column. Six columns, nothing more.
Two habits make this tab actually usable months from now.
First, turn the Category column into a dropdown instead of free text. Select the column, open Data, then Data validation, and point it at the list on your Categories tab. This single step prevents the slow rot where "Groceries," "groceries," and "Grocery" all exist as separate categories because of inconsistent capitalization.
Second, learn one formula and reuse it everywhere: SUMIFS. To find total grocery spending for the month, something like this does the job:
=SUMIFS(Expenses!D:D, Expenses!B:B, "Groceries", Expenses!A:A, ">="&DATE(2026,6,1), Expenses!A:A, "<="&DATE(2026,6,30))That's the whole idea: sum the Amount column where Category matches and the Date falls inside the month. Copy this pattern for every category on your Dashboard tab, and you've got a self-updating breakdown of where the money actually went, with zero manual recalculating.
If formulas like this make your eyes glaze over, build one, get it working, then copy and paste it down the column and just swap the category name in each row. You don't need to be fluent in spreadsheet functions, you need one formula you trust.
Tracking Income, Including the Irregular Kind
If a paycheck arrives on the same date for the same amount every two weeks, the Income tab is almost too simple: Date, Source, Amount. Done.
Freelancers, hourly workers, and anyone with commission or seasonal income need one more habit: track every deposit as it lands rather than estimating monthly income up front. Then, instead of budgeting against this month's number, budget against a trailing average:
=AVERAGEIFS(Income!C:C, Income!A:A, ">="&EDATE(TODAY(),-3))That formula averages income from the last three months, which smooths out the lumpy months and gives you a steadier number to plan spending around than whatever happened to land in your account this week.
Turning the Numbers Into a Dashboard
Numbers in a table are accurate but invisible. A dashboard makes the same numbers impossible to ignore.
Start with three things on the Dashboard tab: total spent this month, total income this month, and the difference. Pull each category's spending next to its budgeted amount from the Categories tab, then add a simple remaining-balance column, budget minus spent. Anyone glancing at this tab should immediately see which categories still have room and which are already over.
Then add visuals. Select the category breakdown table, open Insert, then Chart, and a pie chart instantly turns six rows of numbers into a shape you can recognize at a glance, the kind of chart you'll actually look at on your phone before deciding whether takeout is a good idea tonight. A second chart, a simple bar comparing budgeted versus actual per category, makes overspending visually obvious in a way a number sitting in a cell never quite manages.
If you want to slice the data differently, by month, by payment method, by week, skip writing more formulas and use a pivot table instead. Select the Expenses tab, open Data, then Pivot table, and drag Category into rows and Amount into values. It updates automatically every time you log a new expense, with no formula maintenance required.
Setting and Tracking Savings Goals
Monthly budgeting and savings goals run on different clocks, which is exactly why they deserve a separate tab. For each goal, an emergency fund, a trip, a down payment, track four numbers: target amount, current saved, monthly contribution, and a calculated percent complete:
=Current Saved / Target AmountFormat that result as a percentage, then apply a data bar through Format, Conditional formatting, Color scale, or the built-in data bar option, so the cell itself fills up visually as you get closer. Watching a bar creep toward 100% does something a plain number never manages, it makes saving feel like progress instead of deprivation.
Automating Data Entry So You Actually Keep It Up
The single biggest reason budget spreadsheets get abandoned isn't bad formulas, it's the friction of typing every purchase into a spreadsheet app on a tiny phone screen. A few approaches handle this differently:
| Method | Effort | Best For |
|---|---|---|
| Typing into the Sheets app | Low setup, slower daily use | People who check their phone constantly anyway |
| Linked Google Form | About 15 minutes to set up, instant daily use | Logging expenses in two taps from a home screen shortcut |
| Bank CSV export and import | No daily typing, weekly batch work | People who'd rather review once a week than log in real time |
A linked Google Form is worth the fifteen minutes it takes to build. Create a short form with fields for Date, Category, Description, and Amount, link its responses to your Expenses tab (Google does this automatically when you create the form from within Sheets), then save it to your phone's home screen. Logging a purchase becomes a couple of taps, not an app switch and a spreadsheet hunt.
For the CSV route, most banks let you export a transaction history as a spreadsheet file. Importing it weekly through File, Import, Append to current sheet, trades real-time tracking for far less daily effort, a reasonable trade if real-time logging was the thing making you quit in the first place.
Visual Alerts With Conditional Formatting
A budget you have to interpret is a budget you'll eventually ignore. Conditional formatting removes the interpretation step entirely.
On the Dashboard, select your remaining-balance column and set a custom formula rule so any negative value turns the cell red. Now overspending isn't a number you have to notice, it's a color that announces itself the moment you open the tab. Add a yellow rule for categories that have crossed 80% of their budget, and you get an early warning before you've actually gone over, not just a postmortem after the damage is done.
Quick win: color rules only need to be set once per column. After that, every new row you log inherits the same red and yellow warnings automatically, no extra work required month after month.
The Monthly Review Ritual
A spreadsheet without a recurring habit attached to it is just a document that gets stale. Pick one day a month, the first Sunday works well for a lot of people, and run through the same short checklist every time:
- Compare actual spending to budget in each category and note which ones ran hot.
- Adjust next month's budget numbers based on what actually happened, not what you wish had happened.
- Check savings goal progress and update the monthly contribution if income changed.
- Archive the month's data if the sheet is getting long, or duplicate the tab for a fresh month.
Fifteen minutes, once a month, is the difference between a spreadsheet that reflects your actual financial life and one that quietly drifts out of date until you abandon it.
Mistakes That Quietly Sink a Budget Spreadsheet
A few patterns show up again and again in budgets that get abandoned within a couple of months.
Too many categories. Twenty-five granular categories sound thorough but turn every transaction into a small decision. Most people do better with eight to twelve broad categories than thirty narrow ones nobody can keep straight.
Never reconciling against the bank. A spreadsheet that drifts from what the bank account actually shows stops being trustworthy, and an untrustworthy budget gets opened less and less often.
No buffer for irregular expenses. Car repairs, annual subscriptions, and birthday gifts aren't surprises, they're just irregular. A modest "miscellaneous" category absorbs these without blowing up every other category when they show up.
Treating one overspent month as a failure. A single hard month doesn't break the system, it's one data point. The spreadsheets that survive are the ones where someone shrugs at a bad month, adjusts next month's numbers, and keeps going.
Going Further: Apps Script, Shared Budgets, and Templates
Once the basics feel automatic, a few upgrades are worth exploring. Google Apps Script can send a weekly email summary of spending by category, no manual checking required, since it's a small script attached directly to the sheet rather than a separate tool to manage. Couples or roommates splitting expenses can use IMPORTRANGE to pull one person's Expenses tab into a shared combined dashboard, without merging entire spreadsheets or handing over full edit access to everything. And if building tabs from scratch feels like a lot up front, plenty of well-built free templates exist as a starting skeleton, the formulas and structure described in this guide work the same way whether every tab is built from scratch or adapted from someone else's layout.
Final Thoughts
None of this needs to be elaborate to work. The spreadsheets that actually last aren't the ones with the most charts or the cleverest formulas, they're the ones simple enough that opening them on a Tuesday night doesn't feel like a chore. Start with the five tabs, the one SUMIFS formula, and a fifteen-minute monthly review. Add the dashboard charts and automation once the basic habit sticks. A budget you actually use beats a perfect one you abandon in March.

Finance & Fintech Research Team
The Kodivio team analyzes financial tools, investment platforms, and fintech trends based on independent research and market data.
Learn more about us →